Making Science Graphs and Interpreting Data>
Practice Interpreting Data
|
Question 1
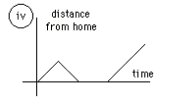
a. iv is the right answer because the person forgot their books and had to go back to get them.
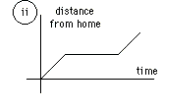
b. ii is the right answer because the plateau shows that the person took that much time to change the flat tire.
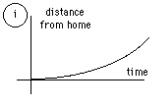
c. i is the right answer because it shows how the person sped up after realizing they were late.
Question 3
a. On the graph, two sets of data are represented.
b. The graph probably began on the month of April. c. July is the month where the graph reaches its highest point. Question 5
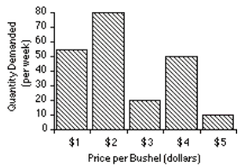
a. The dependent variable is the quantity demand per week.
b. No, the price per bushel does not always increase with demand because when it was the highest in demand, it was only $2. c. The demand is 10 when the price is $5 per bushel. Question 7
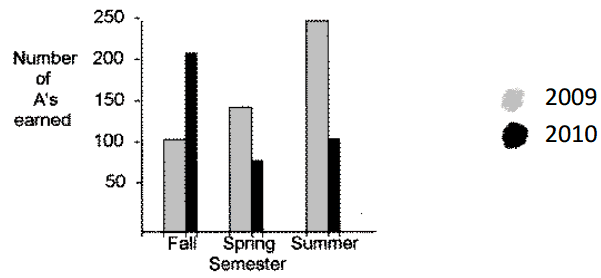
a. About 240 A's were earned during the Spring and Fall of 2009.
b. Around 125 A's were earned in the Fall than in the Spring (2010). c. The most A's were earned in 2009. d. The Summer semester is when the most A's were earned. e. The Spring of 2010 had the fewest A's earned. Question 9
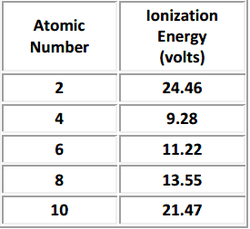
a. The independent variable is the atomic number.
b. The dependent variable is the ionization energy. c. There are 5 elements shown. d. Atomic number 2, Helium, has the highest ionization energy. e. If this chart was a graph, the shape of the graph would be zig-zag. |
Question 2

a. 13% of the day is spent waching tv.
b. About 8 hours is spent sleeping for an average teenager. c. Studying is the activity that uses less amount of time. d. School is the activity that takes up 25% of the day. e. Sleeping and talking on the telephone are the two activities that take up 50% of the day. f. The two activities that take up 25% of the day is talking on the telephone and eating. Question 4
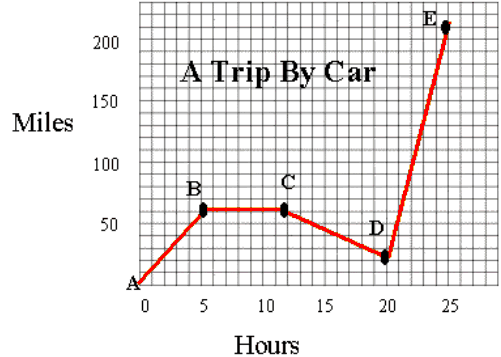
a. In total, the car traveled 210 miles.
b. 4 mph was the average speed of the car for the trip. c. Between the hours of 5 and 12, the car did not move. d. In line CD, the car was going the opposite direction. e. About 20 miles was how much the car drove for the first two hours of the trip. f. The fastest speed is represented by line DE. Question 6
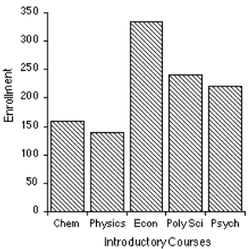
a. The total freshmen enrolled in the college is around 1,100.
b. The percent of students majoring in physics is 4%. c. About 340 students are majoring in economics. d. About 10 more people are in poly sci than psych. Question 8
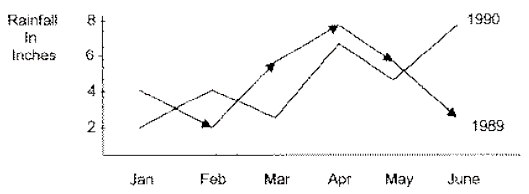
a. Around 5 inches of rain fell in March 1989.
b. 2 more inches fell in February 1990 than in February 1989. c. 1989 (27 in.) had more rain than 1990 (25 in.) d. April was the wettest month. Question 10
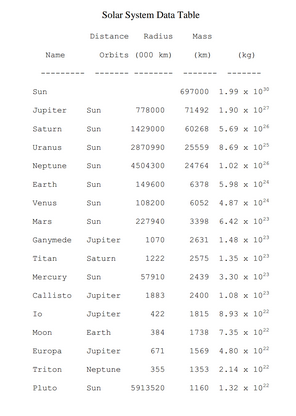
a. Nine planets are represented.
b. Seven moons are represented. c. The moon Io has the largest mass. d. The planet Venus has a radius closest to Earth. e. Six moons are larger than the planet Pluto. f. Io orbits closest to Jupiter. g. Planet Venus is closest to Earth. |
Practice Graphs
|
Question #1
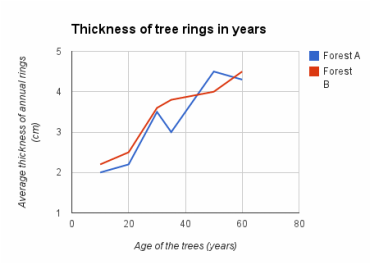
b. The dependent variable is the average thickness of annual rings.
c. The independent variable is the age of the tree. d. 3.75 cm is the average thickness of rings for forest A for 40 years. e. Forest A probably had more problems such as lack of water or maybe insects than forest B. Question #3
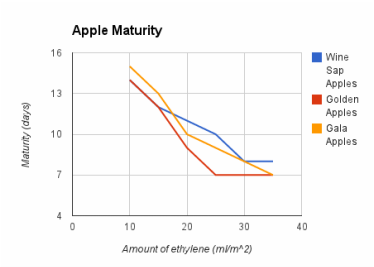
b. The dependent variable is the days of maturity.
c. The independent variable is the amount of ethylene (mL/m^2). |
Question #2
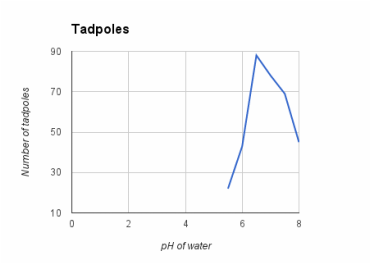
b. The dependent variable is the number of tadpoles.
c. The independent varialbe is the pH of water. d. 6.75 is the average pH. e. 83 is the average number of tadpoles per sample. f. The optimum water pH is 6.5 pH for tadpole development. g. The greatest change of tadpoles number is 5.5 and 6.5 pH of water. h. Probably lower than 15 tadpoles would be found in a pH of 5.0. |
